Summary
- Exhibitors are spending more on booth space and promotion whereas spending on exhibit design and show services has decreased.
- China remains the #1 country in Asia in terms of booth space sold and is six times larger than the #2 country (Japan).
- The trade show industry in Australia is still healthy and growing at 3.1% per year.
- More exhibitors around the world are incorporating digital services and products into their exhibits. 100% of exhibitors in Germany have already digitised their booths.
Trade shows play an important part in a country’s economy. For example, in Germany, the trade show sector generates over 3 billion euros per year.
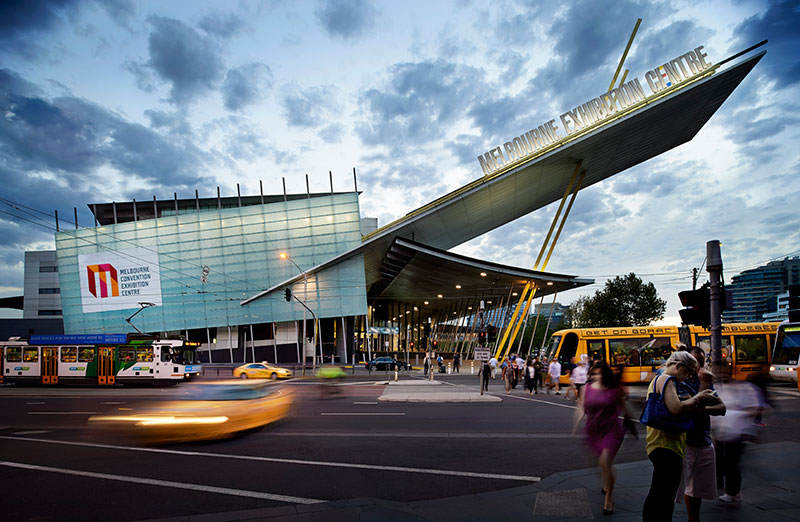
In 2014, there were over 2,000 exhibitions staged in Australia, attracting over 9.3 million visitors and over 65,000 exhibitors. Exhibitions as part of a conference were the most common type of exhibition, although these events tended to be small in scale.
Trade shows in Australia
| Number of exhibitions | 2,157 |
| Number of attendees | 9,354,553 |
| Number of exhibitors | 65,203 |
Overall, 3% of exhibition visitors were from overseas, 6% were from interstate and 91% were from within the event state.
Trade show spending and budget allocation

- Exhibit space increased from 29% to 39%.
- Promotion increased from 9% to 13%.
- Exhibit design decreased from 18% to 11%.
- Show services decreased from 18% to 11%.
Exhibitors are spending more on booth space and marketing whereas their budget allocation to exhibit design and show services have declined.
Fastest growing countries for trade shows
In 2016, 20.77 million m2 of space was sold globally by exhibition organisers which represented a 5.5% increase compared to last year.
Out of that, 58% was sold in China at 12 million m2. To put that into comparison, the space sold in China is six times larger than Asia’s second largest trade show market, Japan (2.06 million m2 sold)
The Philippines was the fastest growing in Asia in 2016 with a growth of 9.6%.
| Country | Growth in space sold |
|---|---|
| The Philippines | 9.6% |
| China | 7.7% |
| India | 7.4% |
| Vietnam | 7.3% |
| Indonesia | 5.8% |
| Thailand | 3.8% |
| Australia | 3.1% |
| Korea | 2.7% |
| Taiwan | 2.3% |
| Japan | 0.5% |
Asia also now offers more exhibition venue space than North America. Europe still remains at the #1 spot and captures 45% of the global exhibition market share.
Total number of exhibitions (Asia-Pacific)

| Industries | No.of exhibitions |
|---|---|
| Industrial and heavy machinery | 346 |
| Discretional consumer services, education, and travel | 277 |
| Electronics, IT, and telecommunications | 204 |
| Consumer goods and retail trade | 190 |
| Building and construction | 181 |
| Food and beverage | 174 |
| Transportation | 130 |
| Medical and healthcare | 134 |
| Agriculture, forestry, and energy | 107 |
| Business services, financial, legal, and real estate | 95 |
| Security and defence | 67 |
Total space rented (Asia-Pacific)

| Industries | Average size (in sqm) |
|---|---|
| Consumer goods and retail trade | 3.1 million sqm |
| Building and construction | 2.6 million sqm |
| Industrial and heavy machinery | 2.3 million sqm |
| Discretional consumer services, education, and travel | 2.3 million sqm |
| Electronics, IT, and telecommunications | 1.7 million sqm |
| Transportation | 1.1 million sqm |
| Food and beverage | 1.0 million sqm |
| Medical and healthcare | 0.9 million sqm |
| Agriculture, forestry, and energy | 0.6 million sqm |
| Business services, financial, legal, and real estate | 0.4 million sqm |
| Security and defence | 0.3 million sqm |
The exhibition industry is going digital

In UFI Global Exhibition Barometer 2017 report, 2 out of 3 survey participants reported that they have added digital services/products like apps and digital signage around their existing exhibitions.
In Germany, 100% of survey participants reported that they have added digital services/products in their exhibit booths. 82% in Brazil and 73% in US.
| Digitisation efforts | % of respondents |
|---|---|
| Added digital services/products around our existing exhibitions like apps and digital signage | 65% said yes |
| Changed internal processes and workflows in our company into digital processes | 59% said yes |
| Developed a digital transformation strategy for individual exhibitions/products | 33% said yes |
| Developed a digital transformation strategy for the whole company | 23% said yes |
| Created a designated function in management | 23% said yes |
| Launched digital products not directly related to existing exhibitions | 19% said yes |
Bottom line
- Exhibitors are spending more on booth space and promotion whereas spending on exhibit design and show services have decreased.
- China remains the #1 country in Asia in terms of booth space sold and is six times larger than the #2 country which is Japan.
- The trade show industry in Australia is still healthy and growing at 3.1% per year.
- More exhibitors around the world are incorporating digital services and products into their exhibits. 100% of exhibitors in Germany have already digitised their booths.
Our range of exhibition displays
Source
- http://www.ufi.org/wp-content/uploads/2016/01/2014_exhibiton_industry_statistics_b.pdf
- https://www.iaee.com/wp-content/uploads/2016/05/2004EEAABenchmarkingReportFinal.pdf
- https://eeaa.com.au/wp-content/uploads/2016/12/FACT-SHEET-EEAA-Market-Monitor-2015-Wave-7.pdf
- https://eeaa.com.au/wp-content/uploads/2016/12/AMAA-Insights-for-the-EEAA-FY2015.pdf
- https://eeaa.com.au/wp-content/uploads/2016/10/EY-report.pdf
